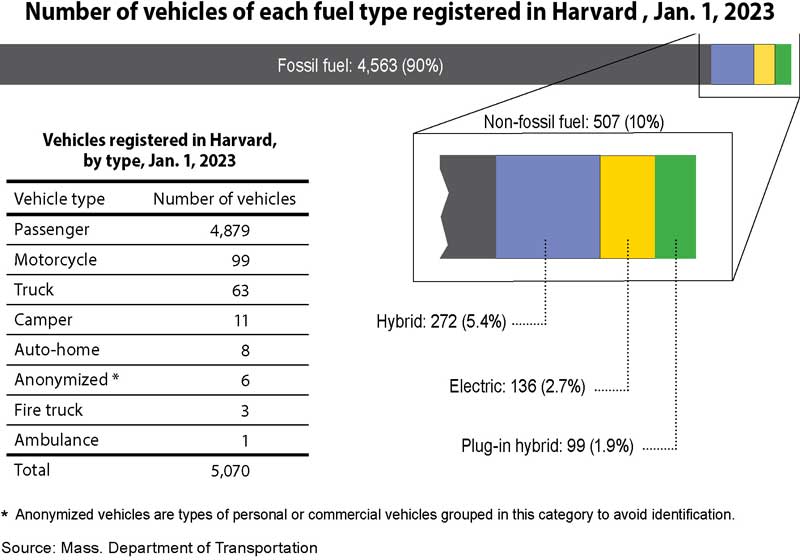
According to a state vehicle census, Harvard is making progress toward reducing its contribution to greenhouse gas emissions. A new online “dashboard” tool that enables the public to view statistics about vehicles garaged in every municipality shows that residents have reduced the number of average daily miles driven over the past three years. It also shows that ownership of non-fossil fuel vehicles has increased over that same time period.
The information was collected from excise tax, registration, and vehicle inspection data. Odometer readings at annual inspections were used to determine how many miles each vehicle in the state was driven since its previous inspection.
There are counts of vehicle types, including the basics such as truck or motorcycle, but also the number of passenger, commercial, and municipal vehicles, as well as counts of vehicles with the various power sources. Average mileage per day is available for every type of vehicle, both at the state and municipal level.
The dashboard revealed that on the first day of 2023, 5,070 vehicles were registered in Harvard. Of those, more than 96% were passenger cars or trucks (see table below), and nearly 96% were private use vehicles. About 3% were commercial vehicles, and 1% were municipal vehicles. Surprisingly, the number of total vehicles registered in town on that day was lower by 73 vehicles than the number registered on that same day in 2020.
Of the total number of vehicles registered in town on Jan. 1, 2023, 90% were powered by fossil fuel. While that may seem disappointing, three years ago, it was 93%. In addition, Harvard is doing much better than the state, where 95.6% of all registered vehicles were powered by fossil fuel as of the first of the year.
Of the non-fossil-fuel-burning vehicles in Harvard, a little over half were hybrids, which use fossil fuel to recharge the batteries while driving. About a fifth were plug-in hybrid, which uses electricity to recharge the batteries and an internal combustion engine as a backup for when the batteries are drained. The remainder were powered solely by electricity. There were no fuel cell vehicles, which are powered by hydrogen, registered in Harvard as of Jan. 1 this year.
One encouraging statistic is that the average vehicle miles per day in Harvard fell over the three-year period that the dashboard covers. It dropped from 29.6 miles for the year ending Jan. 1, 2020, to 28.3 miles for the year ending Jan. 1, 2023. In addition, vehicles powered by advanced technology were driven more miles per day, on average, than those powered by fossil fuels.
Mileage at any single point in time is not up to date since it’s based on data obtained at annual inspections. If a vehicle is inspected in February, for example, its data for the remainder of the year wouldn’t be available until February the following year. Looking at that vehicle’s mileage data in January 2023, for example, would show how many miles were driven between February 2021 and February 2022.
Still, the dashboard is a powerful tool for showing trends in the ownership of non-fossil fuel vehicles and daily vehicle usage. In a press release issued last summer, Massachusetts Climate Chief Melissa Hoffer said, “This tool will allow us to track our progress toward our climate goals as it relates to vehicle usage, and the data collected will help guide our decision making around how to allocate resources and investments across the Commonwealth to achieve a greener and healthier future.”
The online dashboard is available at https://geodot-homepage-massdot.hub.arcgis.com/pages/massvehiclecensus.