Data released by the U.S. Census Bureau last week revealed an increase in diversity across the nation and a sharp rise in the number of people who identified as multiracial. Compared to data from the 2010 census, Harvard mirrored those trends, with a near-tripling—from 109 to 319—of the number of residents who self-identified as multiracial.
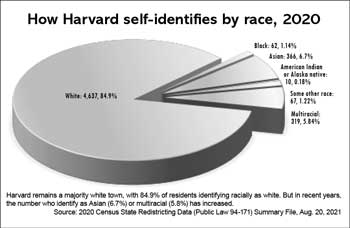
Harvard remains a white majority town, but the number of people who identified as white-only declined from 93% to 85% since the last census, and the diversity of Harvard’s population grew, with noticeable increases in the number of people who identified racially as Asian and Black, as well as the number identifying ethnically as Hispanic or Latino.
“As the country has grown, we have continued to evolve in how we measure the race and ethnicity of the people who live here,” said Nicholas Jones, a director and senior advisor for race and ethnicity research and outreach at the Census Bureau, in a press release. “Today’s release of 2020 census redistricting data provides a new snapshot of the racial and ethnic composition and diversity of the country.”
The latest numbers are part of an Aug. 12 redistricting data release, a partial release by the Census Bureau of data collected for the 2020 census, a snapshot of the U.S. population on April 1, 2020. The release provides lawmakers in the 50 states, the District of Columbia, and Puerto Rico with population counts to use in their redrawing of congressional and state legisla-tive district boundaries. The Census Bureau promises more detailed data in more user-friendly formats next month.

Harvard’s total population increased by 8% over the last decade, according to the 2020 census, growing from 5,063 people to an estimated 5,461 people. These numbers are lower than those reported for Harvard by The Boston Globe and others, which included Devens residents and inmates at the Federal Medical Center in Devens in their totals. Harvard’s growth mirrors that of the state, which grew 7.2%, allowing it to retain its current nine congressional representatives until the 2030 census.
A more diverse, multiracial population
According to materials provided to the media by the Census Bureau last week, the 2020 census showed a 276% increase in the nation’s multiracial population—those who identify with two or more racial categories—which now totals 33.8 million people. The growth of that category is evident in Harvard’s data as well. In 2010, 98% of Harvard’s population identified as belonging to a single race. But that number dropped to 94% in 2020 while the number of people in Harvard who identified as being in the “white and some other race” category increased significantly. In the 2010 census, only three Harvard residents self-identified with that category, whereas by 2020 that number had grown to 164 people.
Census officials say some of the increase in those identifying as multiracial may be due to changes in the questions they used in 2020 to collect race and ethnicity data. The 2010 and 2020 census both used the required two separate questions (one for Hispanic or Latino origin and one for race) to count the races and ethnicities of the U.S. population, following the standards set by the U.S. Office of Management and Budget (OMB) in 1997. But on the 2020 form, both questions were expanded to capture more precise information about the racial identity and the country or region of origin of each respondent.
Additional choices, including write-in boxes, were added to some racial categories in order to enable “a more thorough and accurate depiction of how people prefer to self-identify.” Respondents who identified as Black or African American, for example, were asked to write in a more precise ethnic identity, such as “African American, Jamaican, Haitian, Nigerian, Ethiopian, Somali, etc.” Those details have been compiled, but were not included in the data released by the Census Bureau last week. The agency says they will be made available in September.
Compared to other minority groups, Harvard’s Asian population grew the most. Residents who identified as Asian-only increased from 175 people in 2010 to 366 people in 2020. Residents who identified as white and Asian increased, from 66 people in 2010 to 98 people in 2020.
The number of people in Harvard who identified themselves solely as Black or African American also grew, from 20 people to 62 people. Those identifying as “white and Black or African American” doubled from 10 to 24.

The 2020 census form included for the first time the ability to self-identify as “some other race,” giving respondents the opportunity to write in a race name other than “multiracial” or one of the five traditional categories (white-only, Asian-only, and so on.)
The only ethnic—rather than racial—information in the Aug. 12 release is whether residents are of Spanish, Hispanic, or Latino origin—or not. Data in that release shows that the U.S. Hispanic or Latino population, which includes people of any race, reached 62.1 million in 2020, having grown 23%, while the population that was not of Hispanic or Latino origin grew 4.3%. Harvard showed an increase in the number of people who identified as Hispanic or Latino, growing from 98 people in 2010 to 163 people in 2020.
Harvard and neighboring Acton, Lancaster, Shirley, and Stow showed some of the lowest total population growth rates among towns in Boston’s western suburbs, sharing growth rates of less than 10%. Harvard’s population increased by 8% in the last decade, but Shirley’s increased by only 3%. Bolton, in contrast, had the highest population growth among the surrounding towns with a 15.7% increase, followed by Ayer and Littleton. These population statistics, sourced from The Boston Globe, include numbers of inmates at state prisons in Shirley and Lancaster.
Harvard’s neighbors also differed in the diversity of their populations. The 2020 census counted 24,021 people in Acton, making it the most populous town near Harvard. A total of 1,087 Acton residents identified as multiracial in 2020—a large jump from the 340 residents who identified as multiracial in 2010. Bolton, a neighboring town that counted 5,665 people in the 2020 census, had an increase of 209 residents who identified as multiracial.
As in Harvard, the number of people who identified as Asian-only in surrounding towns grew the most among minority groups. Harvard’s Asian population grew 175 to 366, or 6.7% of the total population. The 2020 census counted 826 people in Littleton who identified as Asian-only, compared to 350 people in 2010. Littleton residents who identified as Asian-only in 2020 made up 8.1% of the town’s total population. And in Acton, those who identified as Asian-only in 2020 made up 25.1% of the total population, increasing from 4,062 in 2010 to 6,024 in 2020. (For additional town-by-town detail, see table.)
The Press reached out to a number of town and state officials for comments, who said they have not had enough time to study the data.
While initial data from the 2020 census was released in the form of raw data tables last week to allow work to begin on redistricting, the Press was able to extract the numbers that are relevant to Harvard. Along with the additional data that will be released by the Census Bureau in September, more tools will be made available that make analyzing the data easier for news organizations policymakers.
Census numbers guide leaders and decision makers at national and local levels. For Massachusetts and the rest of the nation, this data could be used to redistribute political power and guide civil rights law enforcement. And for Harvard, this data will influence decisions regarding the distribution of state and federal aid as well as the boundaries of state and congressional districts.
For more information, see:
- Census Bureau, “2020 Census Statistics Highlight Local Population Changes and Nation’s Racial and Ethnic Diversity,” Aug. 12, 2021: www.census.gov/newsroom/press-releases/2021/population-changes-nations-diversity.html
- Boston Globe, “Map: See how each Mass. town has changed according to new census data,” August 12, 2021: Note that the Globe’s numbers for Harvard include the inmates of the Federal Medical Center in Devens and residents of Devens who live within the historical boundaries of the town of Harvard. https://www.bostonglobe.com/2021/08/12/metro/new-census-data-see-how-each-mass-town-has-changed/?p1=BGSearch_Advanced_Results
John Osborn contributed to this story. Joan Eliyesil managed retrieval of census data and provided technical support.