
Welcome to Harvard, where the stone walls are strong, the fields are good looking, and the construction grade of its houses is … average to good.
Last year, assessors downgraded the construction quality of more than half of the single-family houses in Harvard, leaving far fewer houses in the very good to excellent range, and the bulk of houses in the average to good range. Downgrades resulted in lower building values (and property taxes) for many residents, especially those whose houses were once graded in the high ranges. But for the group of residents whose house grades went down only slightly, or not at all, building values—and thus property taxes—
increased because of the 2018 townwide revaluation.
While most taxpayers consider annual tax rate fluctuations as the major contributor to a change in their tax bill and assume that everyone’s bill goes up or down by the same percentage, that has not been the case for the past two years. Widespread changes to a single aspect of a town’s assessments can raise the values of some properties and lower others, sometimes driving large tax increases for some homeowners and decreases for others. Such was the case in fiscal 2018 when assessors adjusted the land values of every property in town, increasing some and decreasing others. This year, property tax bills are reflecting another uneven change, this one caused by regrading.
Each year, assessors are required to adjust assessments to keep them in line with market values, a process called revaluation. But, according to Harald Scheid, president of Regional Resource Group (RRG), which is now Harvard’s regional tax assessor, inconsistent house grades made revaluation difficult in Harvard. So last year, David Manzello, vice president of RRG, did a complete review of the town’s assessments to ensure that grades were consistent. Scheid said assessors assign a grade to a house when it is built, and it is not typically changed unless the house undergoes a major renovation. The grade represents the quality of the building, including materials, workmanship, and complexity of design. RRG’s grading system is explained in the building grade guidelines below.
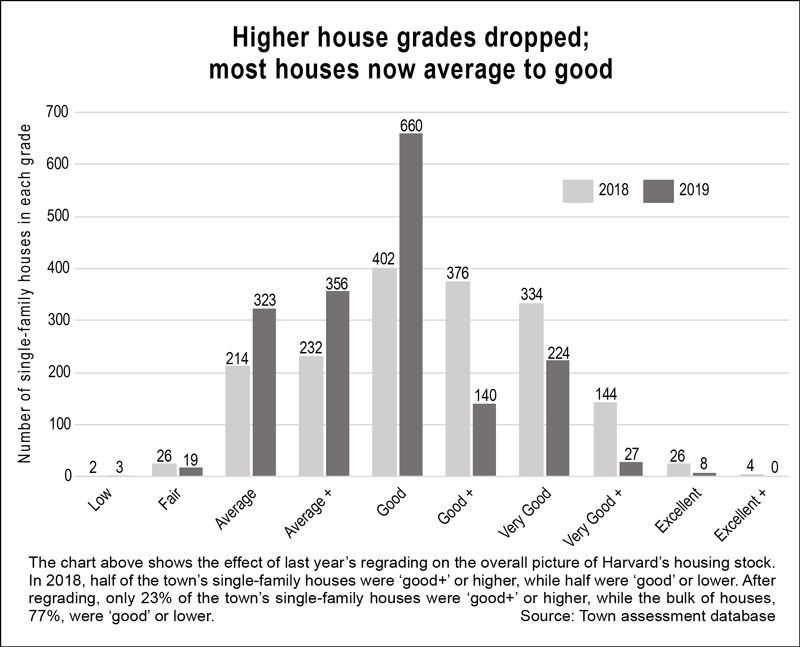
As a result of Manzello’s work, the construction grades of about 53% of Harvard’s single-family houses were lowered, 5% were raised, and 42% stayed the same (see grade bar chart below). Houses with the highest construction grades shrank the most. Prior to regrading, Harvard had 30 houses that were graded “excellent” or “excellent+.” Now there are eight. The number of “very good” houses shrank as well, many slipping multiple steps to “good” or “average+.” On Scott Road, for example, houses built in the ’70s, ’80s, and early ’90s all slipped from a mix of “very good” and “good+” to “good.”

Changes in grade brought financial windfalls to some (see average property tax change table at left). While the majority of downgrades were only half a step, from “good+” to “good,” for example, houses that started with a grade of “excellent” or “very good” typically slipped multiple steps, lowering some building values by hundreds of thousands of dollars. Owners of these houses saw the biggest decreases in their tax bills. And because building values are now lower for this group, their share of the town’s debt going forward will also be lower—welcome news as 25 payments for the new school building will be coming soon.
Lucky and unlucky
Owners of houses that went up in grade were less lucky. While this group comprises only 84 single-family homeowners, their property taxes increased on average about 10.7%. Grade raises typically happened in neighborhoods where houses were constructed by the same builder, such as Candleberry Lane. Four houses there were raised from “good+” to “very good,” which now matches the grade of the rest of the street.
Small decreases in grade typically translated to either a small decrease or a small increase in building values, and thus, in tax bills. That’s because most building values went up during the annual revaluation process, and that offset the financial effects of downgrades overall. Values are calculated independently of grades, and the grade is used as a multiplier. For example, the assessor’s annual revaluation might set the value of a building at $200,000. If that building had a grade higher than “average,” its value would increase when the grade multiplier was applied. This year’s tax rate increase, 27 cents per thousand of property value, played only a small part in tax increases.
Scheid said he doesn’t know what led to the inflated construction grades, but he admitted that grade is one of the assessment criteria that can be subjective. He said assessors may have assumed that new houses should all be graded high because they are brand new, and they may not have taken into account differences in quality or design. He also said that over time there has been a “changing cast of characters” assigning the grades, ranging from elected officials on the Board of Assessors in the ’70s and ’80s, to a number of different professionals hired by the town to inspect houses and assign grades. RRG has done the majority of assessment work for the town since 2009.
Little change in land values
Assessed values consist of both a building and a land value. This year, there were only a few changes to land values, including a slight increase for waterfront properties. Last year RRG made modifications to the town’s land value tables, which Scheid said were out of date, and land values changed for all properties in town. As the Press reported, those changes resulted in uneven increases to assessments and property taxes in fiscal 2018. Owners of houses assessed at less than $300,000 saw their assessments climb by more than 16%, while million-dollar-plus homeowners saw only a 6% increase. This year’s regrading changes have had a similar effect, with lower assessments and taxes for owners of houses previously considered “very good” or “excellent.”
Scheid said Harvard’s property value database is much more consistent now, and that there is “good reason to believe that future annual revaluations will yield more stable and predictable assessments.”
Construction grades are available in the online assessors’ database, accessible from the town website on the Assessors page. Enter the Geographic Information System (GIS), then click on “Search” and enter your address. When your property comes up, click on it, and a box will open in the center of the screen. Scroll down to “Property Card” and click on that to open your property record. Scroll down to “Building Attributes;” construction grade is the third value in that list. Only the current grade is visible; the Assistant Assessor at Town Hall can look up last year’s grade. If your building value went down last year, your grade likely did as well. Building values for this year and the two years prior are available at the bottom of the property record, under “Improvements.”
Building grade guidelines by Regional Resource Group
RRG uses six grades to reflect the quality of construction of a building. In addition, a “+” is used to indicate a half-step higher than a grade. For instance, “G+” is of higher grade than “G.”
Excellent (Exc): Dwellings with this grade rating are usually unique structures that are individually designed by an architect for a specified user. Such residences typically are constructed from detailed architectural plans and specifications and feature an exceptionally high level of workmanship and exceptionally high-grade materials throughout the interior and exterior of the structure.
Very Good (VG): Dwellings with this grade rating are often custom designed for construction on an individual property owner’s site. However, dwellings in this quality grade are also found in high-quality tract developments featuring residences constructed from individual plans or from highly modified or upgraded plans. The workmanship, materials, and finishes throughout the dwelling are generally of high or very high quality.
Good (G): Dwellings with this grade rating are residences of higher quality built from individual or readily available designer plans in above-standard tract developments or on an individual property owner’s site. The design includes significant exterior ornamentation and interiors that are well finished. The workmanship exceeds acceptable standards and many materials and finishes throughout the dwelling have been upgraded from “stock” standards.
Average (A): Dwellings with this grade rating feature economy of construction and basic functionality as main considerations. Such dwellings feature a plain design using readily available or basic floor plans featuring minimal fenestration and basic finishes with minimal exterior ornamentation and limited interior detail. These dwellings meet minimum building codes and are constructed with inexpensive, stock materials with limited refinements and upgrades.
Fair (F): Dwellings with this grade rating are of basic quality and lower costs; some may not be suitable for year-round occupancy. Such dwellings are often built with simple plans or without plans, often utilizing the lowest quality building materials. Electrical, plumbing, and other mechanical systems and equipment may be minimal or nonexistent. Older dwellings may feature one or more substandard or nonconforming additions to the original structure.
Low (L): While this lowest category is not in RRG guidelines, RRG Vice President David Manzullo told the Press that a typical house graded low would be an “old three-season house, substandard to all code, with possible modifications to live year-round.” Harvard has only three houses in this category.
Source: David Manzello, Regional Resource Group
When economic neighborhoods
came to town
In 1995, assessors introduced five “economic neighborhoods” into the equation for valuing a property’s land. For the first time, a building lot of the same size in one area of town was valued differently from a lot of the same size in a different location. Each street was assigned an economic neighborhood (10–50, with 10 the lowest) based on the recent sale prices of houses in the area.
According to articles in The Harvard Post newspaper from that era, the economic neighborhood concept was not well received by taxpayers, who were described as “irate,” “disgruntled,” and “reacting with some heat.” While most property owners in town noticed little difference in their tax bills, likely because most streets were assigned a neighborhood of 10, residents in neighborhoods 40 and 50 were hit with tax bills 12% to 17% higher than the previous year.
In January 1996, citizens demanded that the selectmen hold a public meeting to discuss the issue. Seventy residents came to the meeting in the elementary school cafeteria to protest the economic neighborhoods. Critics called the assignment of the neighborhoods “too subjective,” and argued that properties across town were homogeneous. But Town Counsel Mark Lanza, after explaining “the fine points” of the process, told the crowd that the only way to change their new revaluations was through an appeal.
And appeal they did. The next week, 93 residents filed for abatements. Three were granted by the Board of Assessors, but only one of those was based on an incorrect neighborhood assignment. Eleven property owners continued their appeal to the state appellate tax board. In 1997, six appeals were still pending; the rest were withdrawn or dismissed. The Press could not find further information on the pending appeals.
Economic neighborhoods continue to this day, although the scale was changed at some point to 20 through 60 and “WF” for waterfront properties. The bulk of the town’s residential properties are now in neighborhoods 30 and 40.
Source: 1995-1997 editions of the Harvard Post and Town of Harvard Annual Reports