In the first installment of this series, printed March 16, the Press reported that last year’s increase in property values, and by extension, property taxes, was felt more by lower-end properties than higher-end properties. This installment reports on the role land value changes played in that disparity. In the next installment, the role of building values will be examined.
While most Harvard residents may not feel as if they live in a neighborhood, for assessment purposes, they do. Every property in town is assigned an “economic neighborhood” code, and that code is used to determine each property’s land value. This year, dramatic changes to the land values in some neighborhoods caused high increases in property values (and taxes) for some residents and decreases for others.
The value of land
Harvard’s zoning bylaws define the minimum lot size for a single-family house as 1.5 acres. About 300 single-family properties in town have less than that amount, and according to Land-Use Administrator Liz Allard, those lots are “grandfathered in,” which means the lots were legal at the time they were created (see Minimum Lot Size at right). Land values of these building lots are defined by assessors in a land table, which defines the relationship of a lot’s size to the dollar value per acre, up to 1.5 acres. In Harvard’s case, Regional Resource Group Inc. (RRG) in Leominster, the company that the town contracts with for assessments, maintains the land table.
Acreage above 1.5 acres is valued differently. In general, the extra land is called “residual land” and is valued at a rate of $20,000 per acre. In some cases, land may have site conditions such as steep topography or wetlands that make it undevelopable (see Classifying Land as Undevelopable at right). If assessors formally classify land as undevelopable, it is valued at $2,000 per acre. Values for residual land and undevelopable land are the same as they were in 2017, so the change in land values from 2017 to 2018 involved only the value of a house’s site.
The neighborhoods
Harald Scheid, president of RRG, explained that economic neighborhoods are used by assessors to recognize locational differences and to bring land values in line with the market. Harvard has six economic neighborhoods, classified from lowest to highest as 20, 30, 40, 50, 60, and WF for waterfront. Neighborhoods are assigned by street, although some streets have multiple economic neighborhoods. For example, Stow Road is mostly in neighborhood 30, but the properties near Interstate 495 are classified as neighborhood 20 because of traffic noise. See list below
Neighborhood 20 is the lowest economic neighborhood, and it contains about 11 percent of the single-family homes in Harvard. Mass. Ave. and Ayer Road are in this neighborhood because of the high volume of traffic on those roads. Other properties are in this neighborhood because of traffic noise or the low average value of houses on the street. The value of a 1.5-acre lot in neighborhood 20 is $211,500.
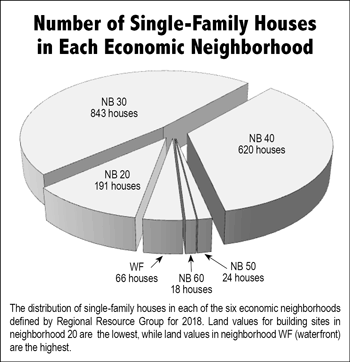
Neighborhoods 30 and 40 make up the bulk of single-family homes in Harvard. Neighborhood 30 is the most prevalent, accounting for 48 percent of all single-family houses, and a 1.5-acre lot in this neighborhood is valued at $235,000. Neighborhood 40, where a 1.5-acre lot is valued at $263,200, accounts for an additional 35 percent of all single-family homes in town. Which neighborhood a street is classified in depends on factors such as the majority of home types, ages, and sizes on the street. Streets that mainly have smaller, older ranch houses and capes will likely be classified as neighborhood 30, while streets with larger, newer colonials will likely be classified as neighborhood 40. Neighborhood 30 includes most of Shaker Hills, as well as most of Still River Road and Littleton Road. Neighborhood 40 includes most of Bolton Road, Old Littleton Road, and East and West Bare Hill roads.
Neighborhoods 50 and 60 are the smallest economic neighborhoods, making up only 2 percent of single-family houses in town. They represent pockets of houses with higher classifications than their neighbors on the same road. A pocket of new, large homes on Old Littleton Road makes up most of neighborhood 50, and views from sections of other roads, such as Bolton Road and West Bare Hill Road, put a few houses there in neighborhood 50, where a 1.5-acre lot is valued at $282,000. Houses lucky enough to have the western view from Prospect Hill Road are the only properties included in neighborhood 60, and an acre and a half lot in this neighborhood is valued at $352,500.
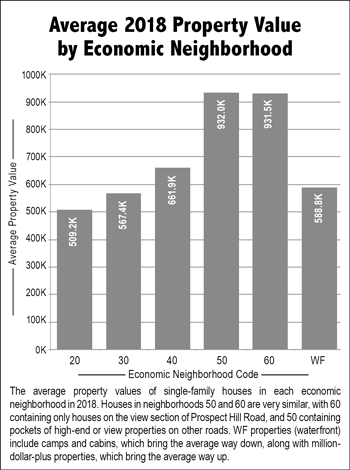
The waterfront neighborhood, which makes up the remaining 4 percent of single-family houses, includes the properties around the pond and on its islands. Because the buildings in this neighborhood range from camps and bungalows on small lots to million-dollar-plus houses with multiple acres, the average property value in this neighborhood is only about $588,000, but the land value for a 1.5-acre lot is $387,750.
Scheid said that neighborhoods can change over time. For example, if large newer homes are being constructed in a neighborhood of smaller ranches, and the newer homes start selling for high prices over an extended period of time, the neighborhood would likely be upgraded. Neighborhoods can also be downgraded if sales justify it. This year, Old Meadow Lane was downgraded from neighborhood 60 to 40, and Glenview Drive was downgraded from neighborhood 40 to 30.
Land values take a leap
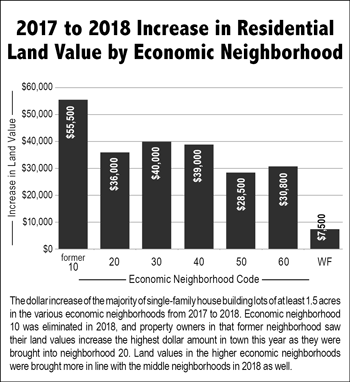
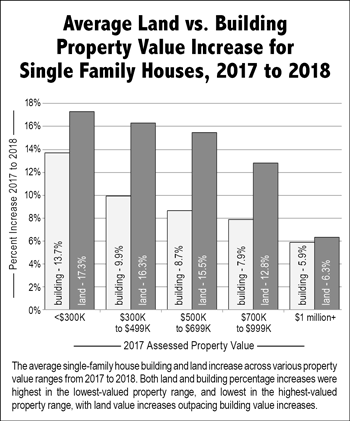
Each year assessors determine the land value of a 1.5-acre building lot in neighborhood 30 based on sales and market value, and they also calculate the value of smaller lots in this economic neighborhood. In 2018, a 1.5-acre lot increased by $40,000 in neighborhood 30, a big leap considering that from 2016 to 2017, there was no increase in the value of a 1.5-acre lot in neighborhood 30, and from 2015 to 2016, the increase was only $5,000. The average increase in land value across all single-family properties in Harvard was 15 percent in 2018.
Land values in the other neighborhoods are a fixed percentage difference from neighborhood 30, and the assessors apply a “neighborhood factor” to determine the land values in the other neighborhoods (see table below). For example, a 0.8-acre lot in neighborhood 30 is valued at $200,000. The factor for neighborhood 60 is 1.5, so a 0.8 acre lot is worth $300,000 in neighborhood 60.
For some, it was only a hop
This year, the neighborhood factor for higher-end properties shrank, and that had the effect of lowering the dollar amount of increase to land values in neighborhoods 50, 60, and waterfront to below the dollar amount increase in neighborhoods 20, 30, and 40. In some cases, including about two-thirds of waterfront properties, the effect was so dramatic that land values went down. Scheid said the land tables needed to be updated to better reflect the actual value of the land, and sluggish sales in the high-end neighborhoods justified bringing those land values closer to the values in the lower neighborhoods. The process is an iterative one, he said, and involves looking at 10 years of sales.

Another contributor to the uneven rise in property values between low-end and high-end properties was the loss of Harvard’s lowest economic neighborhood, classified as 10. Neighborhood 10 comprised about 70 single-family houses, including all the houses on Ayer Road, as well as a few houses at the Bolton end of Brown Road, where traffic noise from Interstate 495 is high. A few other scattered houses were also in this category. Scheid said RRG determined there were not enough ongoing sales to support neighborhood 10, so 10 was eliminated, and its properties were moved up to neighborhood 20. That move caused the largest dollar land value increase in 2018—$55,500 for every lot 1.5 acres or higher in the old neighborhood 10.
Neighborhoods jump together
Finally, because land value goes up a flat dollar amount, the percentage increase is higher for lower-valued homes and vice versa. For example, factoring out increases to building values, if land values go up $40,000 in an economic neighborhood, properties in that neighborhood valued at $800,000 go up only 5 percent, but properties valued at $400,000 go up 10 percent. That effect carries over into property tax percentage increases.
Scheid agreed that Harvard’s 2018 property values were dramatically affected by the update of the land table, but he said he doesn’t anticipate any big changes to the table in the near future. “The first year is the most painful,” he added.
The full list of single-family properties in each economic neighborhood is available below. The property records available online through the town assessors’ GIS website also contain each property’s neighborhood code.
Sources: Data is from the 2018 update of the assessors’ GIS website, which contains property data for every parcel in town. The website is maintained by Vision Government Solutions. The property records of all single-family residences (land-use code 101) on the Vision website were included in the data. The 2018 land table was provided by Regional Resource Group Inc.