
Editor’s note: This is the first in a series of articles in which the Press will examine the changing nature of Harvard’s property values and the town’s single-family housing stock.
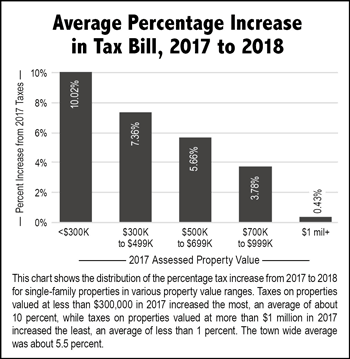
The owner of an antique house near the town center saw her property tax bill jump 15 percent this year for a dollar increase of more than $1,800 despite the fact that she had done no renovations. Owners of single-family houses on Ayer Road saw their taxes rise more than 12 percent on average, far higher than the townwide single-family house average increase of about 5.5 percent. And the dollar amount of property tax owed by the owners of about 30 percent of the million-dollar-plus properties in town actually decreased from 2017 to 2018.

What’s going on? According to Harald Scheid, president of Regional Resource Group Inc. (RRG) in Leominster, the company that does the assessment work for the town, it was the result of the yearly property revaluation. But this year, Scheid acknowledged there had been a combination of factors at work in that revaluation that produced a wide range of increases to assessments, and by extension, property taxes. Those factors included an uneven real-estate market, modifications to the land value tables that factor into every property’s assessment, and a certification year for the townwide valuation.
After the 2008 recession, property values in Harvard have either dropped or remained fairly static. During those years, additional money for the tax levy each year was raised by increasing the tax rate. That affected all properties evenly, levying a dollar amount per thousand of property value. But that’s not what happened this year. A 12 percent rise in single-family residence property values this year allowed assessors to lower the tax rate almost a dollar per thousand and still generate enough revenue to cover the tax levy.
But the uneven way that property values increased made many people long for the years of flat property values and simple tax-rate increases. Data collected from the town’s online assessment database this year showed that, from 2017 to 2018, the property values of the lowest-priced single-family houses in Harvard increased by the highest percentage (on average), and the highest priced single-family houses went up the lowest percentage on average. As expected, this year’s property tax increases followed that same trend, and even dropped off sharply for houses in the million-dollar-plus range, because of the combination of low assessment increases and this year’s lower tax rate.
More than a yearly revaluation
According to Scheid, assessors conduct a yearly revaluation, looking at sales records from the previous year to determine if property assessments are in line with the “full and fair cash value” of the property. The town assessors’ office defines full and fair cash value as “the price a willing buyer would pay a willing seller for property exposed to the market for a reasonable period of time.” The work must be completed by the end of the year, so the sales data used is mainly from the prior year. This year, for example, the work was done in 2017 using a full year of sales data from 2016, and the 2018 assessment was completed in the fall of 2017 before setting the 2018 fiscal year tax rate in November. As Scheid said, assessed values are “reflective, not predictive.”

Normally, the assessors look for trends that involve multiple properties before making any dramatic adjustments based on those trends. But the Massachusetts Department of Revenue (DOR) has required that every town submit its property valuation for certification every three years. For certification years, the DOR requires that assessors respond to every “arm’s-length sale,” especially those where properties sold for either 10 percent above or below the assessed value. And that can lead to raising or lowering assessments in, for example, certain locations or for certain types of houses based on a small number of sales, Scheid said.
According to the town’s property sales records, there was only one arm’s-length sale of a single-family house assessed for more than $1 million in 2016, and it sold for significantly less than its assessed value. Conversely, on Ayer Road, where the average house price was about $445,000 in 2017, one single-family house sold for well over its assessed value in 2016. These two sales contributed to the rise of values on Ayer Road and the fall of values of many high-end properties. Scheid pointed out that in cases like these where sales were limited, assessors looked outside of the 2016 sale period for evidence to support value changes in categories of properties. He added that they also looked for the same trends in towns with a similar market profile to Harvard’s, such as Bolton.
Fixing the land value tables
The assessed value of every single-family residence in town consists of a building value and a land value. One of the factors in land value is the “land curve table,” which defines the relationship of a lot’s size to the dollar value per square foot of the lot. According to Scheid, the long-standing land tables used to assess Harvard’s land values needed to be updated to better reflect those values, and the changes made had an impact on land values throughout town.
After years of property value increases in the early 2000s, the housing market dropped dramatically in the 2008 recession. However, according to Victor Normand of Acton Real Estate, the recovery has finally made it to Harvard. Normand said that towns “outside” Interstate 495 are not typically considered by house hunters who work in Boston or Cambridge, but bidding wars and shortages in the suburbs closer to the city where prices recovered sooner are now driving potential homebuyers to Harvard. “They’re willing to add Harvard to their list now because they can get more house for their money, and they’re willing to make the trade-off of a longer commute,” Normand said.
The number of arm’s-length sales in 2016 (the sales year used for the 2018 assessment) was 58, about the same as it was in 2015. But the number of properties that sold for at least 10 percent more than their assessed value nearly doubled in 2016, creating some of the multiproperty trends that assessors look for each year. Based on these trends, many property values rose this year, depending on location or type of house. For example, according to Scheid, four of the six antique houses sold in 2016 brought prices well over assessed values, and as a result, the property value of most antique houses in Harvard went up more than other house types this year.
Hoping for more stability
The state recently changed the period between certification years from three years to five years, so that process will not affect property values again until 2023. As for the land value tables, Scheid said, “The first year is the most painful.” He added that any fixes in subsequent years will likely be more consistent across all properties. The effects of the real estate market on property values are less predictable. 2017 sales records are already online on the town website, accessible from the assessors’ page, and while the number of arms-length sales is about the same as 2016, it will be up to assessors to identify any trends in property values and raise or lower property values based on those trends.
Next, the Press will look at the impact of land value and location on this year’s revaluation, including an explanation of Harvard’s six “economic neighborhoods.”
Sources
The data used for this article is from the 2018 update of the assessors’ GIS website, which contains property data for every parcel in town. The website is maintained by Vision Government Solutions. Each year, when Regional Resource Group, the company hired to conduct the town’s assessments, completes its revaluation of the town, it provides Vision with updated property data. Once that data is posted, it is not revised again until the following year.
The property records of all single-family residences (land-use code 101) on the Vision website were included in the data. However, in order to avoid skewing the data analysis, 13 new construction properties, one property where the building increased in value more than 60 percent, and three properties where the buildings decreased in value more than 40 percent were not included in the data analysis.