
CLICK CHART TO ENLARGE

CLICK CHART TO ENLARGE

CLICK CHART TO ENLARGE
CLICK CHART TO ENLARGE
If the news that one in four people in Harvard is now over the age of 60 is a surprise, hold on to your hula hoops. Baby boomers are the largest segment of the town’s population. They are moving like a tsunami toward senior citizenship; their kids will soon be gone from the school system; and they don’t seem to be in a hurry to go anywhere.
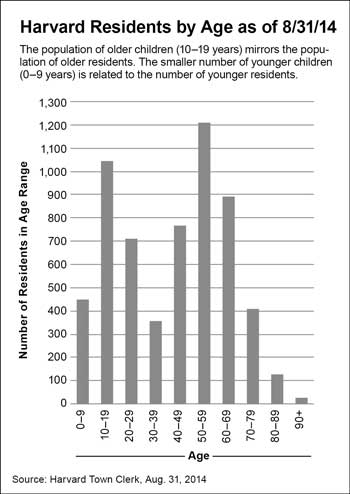
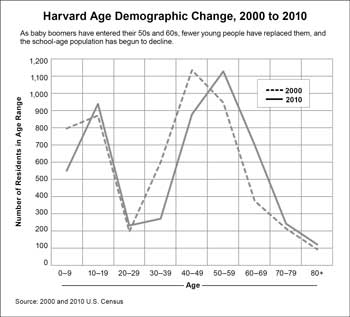
Fresh data from Town Hall and studies done for the forthcoming 2012 master plan update—as well as data from the 2000 and 2010 U.S. Census— shows that the baby boom is alive and well in this town, and that younger boomers, now in their 50s, outnumber the older ones. According to Town Clerk Janet Vellante, people in their 50s comprise the biggest segment of our population, a full 20 percent of residents. Add in the older boomers and that figure climbs to 35 percent. Include people over 70, and you’ll begin to wonder if Harvard is where all of the people went at the end of the movie “Cocoon”—45 percent of us are over the age of 50 (see chart “Harvard Residents by Age,”).
Older than average
Are we an unusually “old” town? A comparison of the 2010 U.S. Census median age for Harvard and its neighboring towns shows that we are, with a median age of 46.8 years (see chart “Median Ages by Town”). But Harvard is not alone in the upward direction of its median age. The phenomenon is national. Largely to account for this is the baby boom, the sharp rise in births that took place during the post-World War II years between 1946 and 1964.
A working paper on housing written for the 2012 Master Plan by the town’s consultant, RKG Associates, Inc., concludes, “Householders of child-rearing age have decreased, and empty nesters and retirees (generally “Baby Boom” residents) have increased disproportionately in Harvard over the past 10 years.”
A rising need for senior services
While baby boomers are poised to dramatically add to Harvard’s elder population, the town is still in the early years of this phenomenon. In 2014 the youngest boomers turned 50 and the oldest turned 68. Some of the older boomers have already begun using senior programs; but for most, the need for services is still some years away. According to Director Deb Thompson of Harvard Council on Aging, the average age when people start needing some form of assistance, such as transportation or outreach services, is 80. In 12 years, when the oldest boomers turn 80 and the youngest are 62, we will likely see a huge increase in the need for both senior programs and services, and that need will last for some time.
Our aging population is already impacting the schools. A 2013 Harvard School Committee report on how to manage declining enrollment shows an 11 percent drop in enrollment since 2007 and predicts a 17 percent drop over the next five years (includes School Choice and Devens students).
Boomer families increased enrollment during the early 2000s, but most of their children have either already moved on to college or attend Bromfield. In 2014, the number of children in the 0-9 age range is half that of those in the 10-19 age range.
Younger buyers missed out
The largest segment of the population that normally produces elementary-school-aged children, people in their 30s, is Harvard’s smallest segment, accounting for only 6 percent of its population. The most likely reason is real estate prices. While most Harvard boomers owned a house here or elsewhere before real estate prices skyrocketed in the late 1990s, people who are now in their 30s missed that window. A report by the Harvard Housing Partnership in 2004 stated, “Home prices rose 54 percent between 1990 and 2000, and the town saw its population of 20- to 34-year-olds drop by 38 percent, more than double the statewide decline.”
Because the baby boom covers an 18-year span, its impact on the number of young families in town is not likely to be a short-term phenomenon. Few options exist in town for downsizing, forcing most baby boomers who want to stay in Harvard to remain “over-housed” in their current three- or four-bedroom homes.
Depressed real estate values are keeping some empty-nesters from moving out of town as they wait for the value of their houses to increase. The 2014 Master Plan Working Paper on Housing states, “Prices are rebounding, up 3.1 percent in 2013 after six years of almost steady declines, but they are still low when adjusted for inflation.” Many houses will remain unavailable to young families until the boomers either move or leave this earth. The wait for that last option could be a long one. According to data compiled by the Social Security Administration, today’s 65-year-old man can expect to live, on average, to age 84, and today’s 65-year-old woman can expect to live, on average, to age 86.
Power at the ballot box
The over-50 population comprises well over 50 percent of voting-age residents, giving this group a lot of power at the ballot box. As people in this group retire, their inclination to vote for capital projects financed by long-term excluded debt may wane.
Town officials grappling with the implications of a swelling older population and shrinking younger population are not exactly spring chickens themselves. The median age of the elected and appointed members of all of Harvard’s boards and committees is 61 (see the chart “Board and Committee Members by Age”).
The shifting demographics affect how the town must plan for the next 10 to 20 years. “A lot has to do with town services,” Town Planner Bill Scanlan told the Press. “If the number of school-aged children is shrinking, we look at things like recreational programs,” he said. “Do we really need six soccer fields? We also look at senior services, such as transportation, meals, and programs, as well as the size of the senior center and elevators in public buildings.”
A lack of housing diversity
Scanlan said the demographic information in the Master Plan housing working paper will be used to help the town figure out its public facility needs. The 2012 Master Plan addresses the need for more diverse housing types in Harvard, especially multi-family houses. According to that document, of Harvard’s 2,047 existing housing units, 91 percent are three or more bedrooms; and the average household size is 2.76. The report states, “It is apparent that housing size exceeds the needs of many households.”
In addition to the work being done to update the Master Plan, the Montachusett Regional Planning Commission—which provides planning services to central Massachusetts towns—will begin an in-depth study of traffic, parking, and pedestrian safety in Harvard’s town center. The study will begin in January 2015 and should be finished by September 2015. The Planning Board will receive the results —a circulation plan that will include recommendations for sidewalks, curb ramps, and crosswalks. While such improvements would benefit everyone, says Scanlan, they are especially important to older citizens.
Opportunity for market-rate housing
As for housing, Scanlan said, “We would expect some activity because of this demographic.” With only 40 percent of its land developed for housing, Scanlan notes, “Someone will recognize the opportunity for a market-rate senior project in Harvard.”
With more than 2,000 baby boomers potentially competing for those houses, maybe market-rate is an understatement.